


The Guide to Federal Reserve Participation in Fixed Income Markets and New Position of the Non-Bank Financial Institutions
The Guide to Federal Reserve Participation in Fixed Income Markets and New Position of the Non-Bank Financial Institutions

This post summarizes "A Hitchhiker's Guide to Federal Reserve Participation in Fixed Income Markets" written by Nina Boyarchenko and Or Shachar.

Intro
They survey the relationship between US fixed income markets and the public sector through the lens of the role of key intermediaries common to US fixed income markets, so-called “primary dealers.” They also analysis non bank financial institutions.
🛡️ Primary Dealers stand guard as the Federal Reserve defends the dollar 💵
Meanwhile, a powerful new force rises…
The Non-Bank Financial Institutions 🐲
A changing market structure—who really controls the Treasury auctions now?
#Fed #Finance #TreasuryMarkets #ShadowBanking
US Fixed Income Markets
U.S. fixed income markets include U.S. Treasuries, mortgage-backed securities (MBS), corporate bonds, municipal securities, federal agency securities, asset-backed securities (ABS).

Fixed Income Issuance in May 2025.

Fixed Income Outstanding in 2024.

Fixed Income Outstanding with infographics in 2024.

Who Holds the Debt?
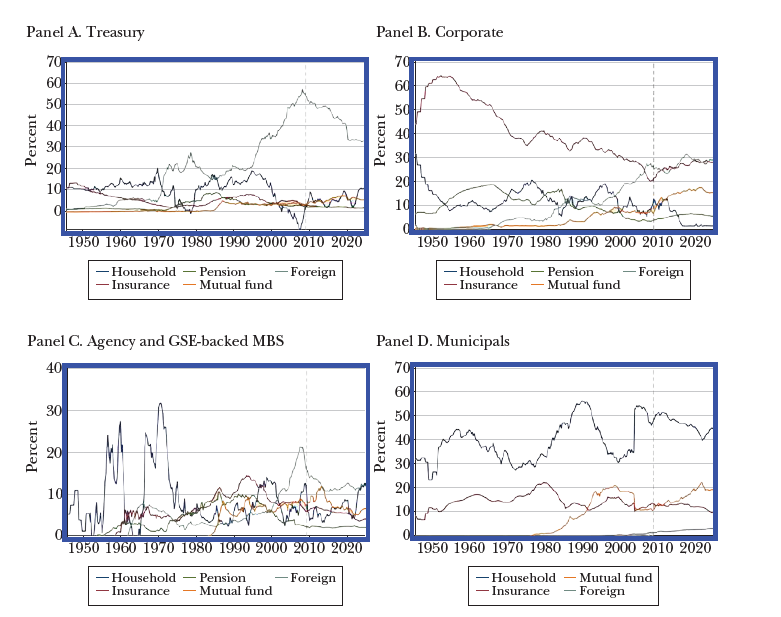
US Treasuries (Panel A) :
Foreign investors became increasingly dominant since the 1970s, peaking around 2009, then declining.
Pension funds and mutual funds have maintained relatively stable shares.
Corporate Bonds (Panel B) :
Insurance companies historically held the largest share but have seen a steady decline.
Mutual funds and foreign investors have increased their presence, reflecting changing investment trends.
Mortgage-Backed Securities (Panel C) :
Households were once major holders but have decreased in prominence.
Foreign investors, mutual funds, and pension funds have grown in significance over time.
Municipal Bonds (Panel D) :
Households remain the dominant investors due to tax advantages.
Mutual funds have gained market share.
Foreign investors play a minimal role due to lack of tax benefits.
Primary Dealers in US Treasuries
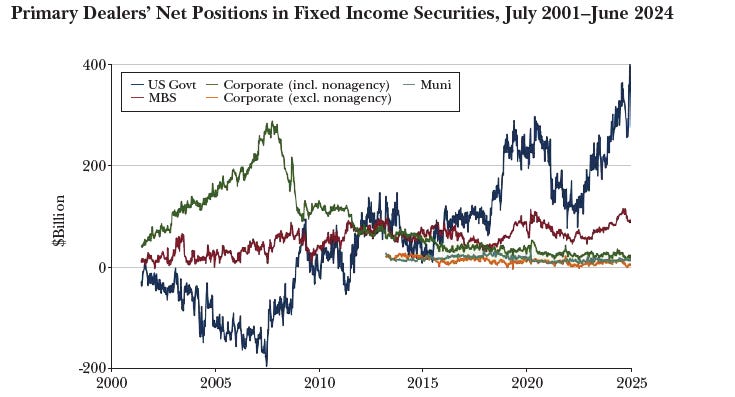
US Treasuries :
Primary dealers currently hold large net long positions , with Treasuries dominating other fixed income markets in terms of size.
This reflects massive Treasury issuance since 2018 .
In the early 2000s, dealers were net short Treasuries (sold more than they bought), likely due to rising rates, volatility, and higher inventory costs.
Despite negative net positions, dealers remained critical liquidity providers during market stress.
Corporate Bonds :
Dealers historically held positive net positions , often moving in the opposite direction of Treasuries (used for hedging interest rate risk).
Post-financial crisis regulations and market structure changes reduced dealer participation.
Corporate bond holdings declined significantly after 2009.
Mortgage-Backed Securities (MBS) :
Primary dealers have maintained relatively small net positions , though active in intermediation.
Their role includes providing liquidity, especially during periods of market instability.
Municipal Bonds :
Net positions are small compared to Treasuries and corporate bonds.
Dealers still play an important intermediation role despite limited outright holdings.
Key Shifts Post-2007–2009 Crisis :
Regulatory changes (e.g., Basel III, leverage ratios) increased the cost of holding inventory.
Resulted in a reduction in corporate bond holdings and an increase in Treasury holdings by dealers.
Changed the traditional relationship between Treasury and corporate bond positions.
Risk Management and Hedging :
Prior to 2007, dealers typically took offsetting positions in Treasuries and corporate bonds to hedge interest rate risk.
Post-crisis, this pattern weakened as dealers adjusted strategies and reduced risk-taking.

Fixed Income Markets and Fed

Here is a summary of the key points regarding Figure (Panel A and B) , which plots the evolution of the Federal Reserve’s balance sheet over the last 25 years:
Panel A – Federal Reserve Assets (in $Billions)
Pre-2008 Composition :
The Fed primarily held U.S. Treasuries .
Other asset classes like agency debt , MBS , loans , and repo agreements were minimal.
Post-Global Financial Crisis (2008–2009) :
The Fed’s balance sheet expanded significantly as part of emergency monetary policy responses.
Mortgage-backed securities (MBS) became a major component of assets.
Reserve balances and liquidity support mechanisms (like repo agreements and loans) also increased.
Response to the COVID-19 Pandemic (2020) :
Another substantial expansion in asset holdings occurred, further increasing the size of the balance sheet.
The composition remained dominated by Treasuries and MBS , reflecting large-scale asset purchase programs (quantitative easing).
Panel B – Federal Reserve Liabilities (in $Billions)
Primary Liability Components :
Reserve balances : Nondemandable deposits held by member banks at the Fed.
Currency in circulation : Physical money supplied to the economy.
Overnight Reverse Repurchase Agreement (ON RRP) : A tool used to manage short-term interest rates.
Post-Crisis Funding Sources :
The expansion of the balance sheet after 2008 was largely funded by increases in reserve balances .
Following the COVID-19 pandemic , there was a notable increase in the use of the overnight reverse repurchase facility (ON RRP) , indicating greater participation from money market funds and other institutions.
The Federal Reserve Purchases Alleviate Balance Sheet Constraints
1. Expanding System Liquidity via Reserves:
Central bank asset purchases increase the supply of reserves in the financial system.
This provides more liquidity to banks, giving them greater capacity to take on deposits and extend credit.
Similar to the Fed’s actions post-9/11 (September 2001), where elevated reserve levels were used to support banking system stability.
2. Relieving Dealer Balance Sheets:
Purchases remove securities from primary dealers' balance sheets , freeing up space and capital.
Allows dealers to engage more actively in market-making , improving liquidity across fixed income markets.
Programs like QE (2008 and 2020) and the Maturity Extension Program (2011–2012) aimed to stimulate intermediation by reducing dealer holdings of Treasuries and MBS.
3. Reducing Market Volatility:
Central bank purchases create predictable demand for securities, reducing the need for distressed sales during periods of stress.
Help stabilize long-term interest rates , reinforcing forward guidance from the Federal Open Market Committee (FOMC).
Lower volatility reduces risk and uncertainty for financial institutions, easing balance sheet pressures.
The Fed's 13(3) Liquidity Toolkit

The Federal Reserve’s traditional role involves conducting monetary policy — mostly through buying/selling Treasury securities and setting short-term interest rates. However, during times of severe market stress , liquidity dries up , markets stop functioning properly, and even creditworthy institutions can’t get the funding they need.
This is where Section 13(3) of the Federal Reserve Act comes in.
Section 13(3) gives the Fed the authority to:
Lend directly to non-bank entities ,
During "unusual and exigent circumstances" (i.e., crises),
To ensure markets keep functioning and credit keeps flowing to households and businesses.
These emergency lending programs — known as 13(3) facilities — were crucial during both the 2008 Global Financial Crisis and the 2020 economic disruption caused by the COVID-19 pandemic .
Houston, We have a problem !
Non-bank financial institutions—such as mutual funds, money market funds, exchange- traded funds, pension funds, insurance companies, and government- sponsored enterprises—are financial companies that do not have a banking license. As of the end of 2024, they are more than three times larger than the US banking system.
The participation of investment funds—including mutual funds, money market funds, hedge funds, money managers, and investment advisors—in auctions of Treasury securities increased from 1.7 percent in January 2008 to 67.8 percent in October 2023, whereas the share attributable to dealers and brokers’ share decreased from 79 percent to 19.4 percent during the same period.

References:
Boyarchenko, Nina, and Or Shachar. 2025. "A Hitchhiker's Guide to Federal Reserve Participation in Fixed Income Markets." Journal of Economic Perspectives 39 (2): 171–94.
US Fixed Income Markets : https://www.sifma.org/resources/research/statistics/us-fixed-income-securities-statistics/
Fixed Income Issuance : https://www.sifma.org/resources/research/statistics/fixed-income-chart/
Fixed Income Outstanding: https://www.sifma.org/resources/research/statistics/fixed-income-chart/