
Forecasting VAR Using EViews: A Step-by-Step Guide ( The Inflation Puzzle: Tired of chasing the next inflation prediction? )
Forecasting VAR Using EViews: A Step-by-Step Guide ( The Inflation Puzzle: Tired of chasing the next inflation prediction?)

Tired of chasing the next inflation prediction? This post offers a data-driven approach! We'll explore how to use a Vector Autoregression (VAR) model in EViews software to forecast inflation in the US. This step-by-step guide will equip you to analyze the impact of supply chain pressures and unemployment on future inflation rates.

We have the following data: the inflation rate, the Global Supply Chain Pressure Index, and the unemployment rate data for the United States for the period of 2000M01-2024M11.
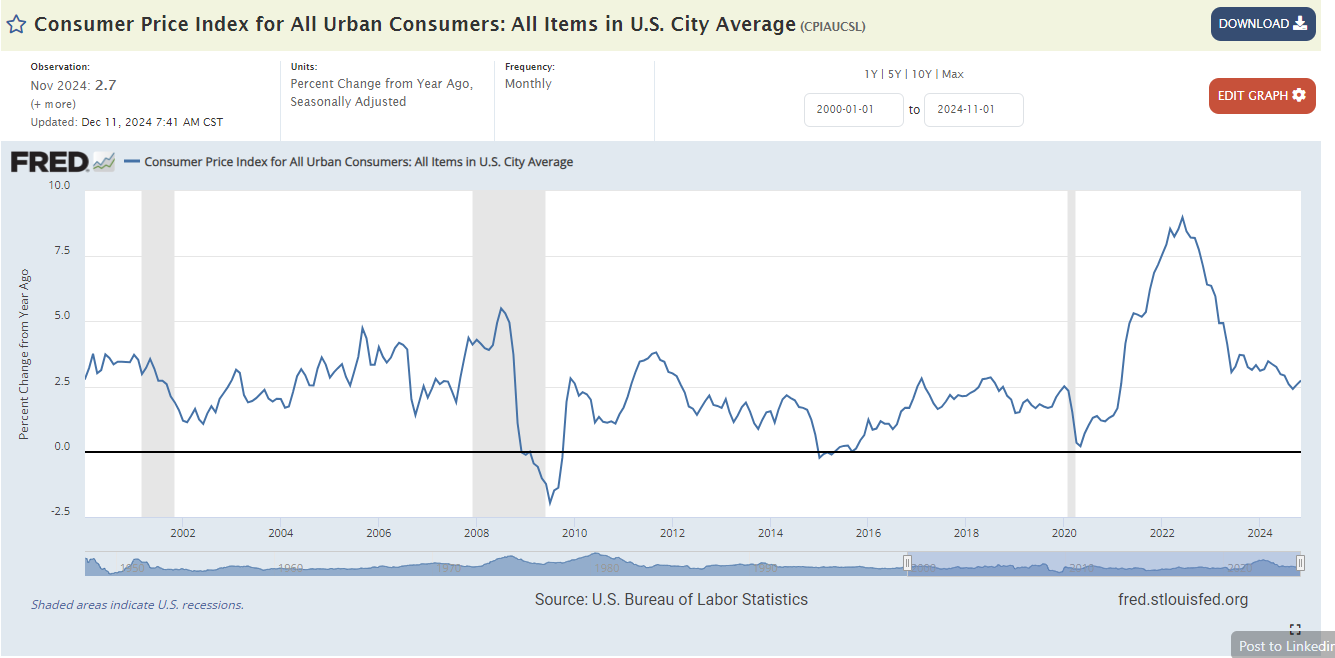
The Consumer Price Index for All Urban Consumers [2000M01-2024M11]: All Items (CPIAUCSL) is a price index of a basket of goods and services paid by urban consumers. Percent changes in the price index measure the inflation rate between any two time periods. The most common inflation metric is the percent change from one year ago. It can also represent the buying habits of urban consumers. This particular index includes roughly 88 percent of the total population, accounting for wage earners, clerical workers, technical workers, self-employed, short-term workers, unemployed, retirees, and those not in the labor force. Source
The unemployment rate [2000M01-2024M11] represents the number of unemployed as a percentage of the labor force. Labor force data are restricted to people 16 years of age and older, who currently reside in 1 of the 50 states or the District of Columbia, who do not reside in institutions (e.g., penal and mental facilities, homes for the aged), and who are not on active duty in the Armed Forces. Source

Global Supply Chain Pressure Index (GSCPI) [2000M01-2024M11] is to develop a parsimonious measure of global supply chain pressures that could be used to gauge the importance of supply constraints with respect to economic outcomes. Source

First, I analyzed the unit root presence in all the series and concluded that all series are integrated of order 1, I(1).

Specify the VAR Model
Open the VAR Object: In EViews, go to Quick > Estimate VAR or use the command window. Estimation sample must be 2000M01-2024M09 because we predict the [2024M01-2024M11] in the original serie.

Determine the Lag Length
The optimal lag length for your VAR model can be selected based on criteria such as AIC, BIC, HQIC, or FPE. EViews provides an automatic lag selection option that you can use.
View/Lag Structure /VAR Lag Order Selection Criteria:

I’ve selected a lag order of 3 based on the lowest AIC: Akaike information criterion value for Vector Autoregression (VAR) model in EViews.

View/Residual Tests /Autocorrelation LM Test:
There is no serious residual serial correlation problem.

Stability Condition
No root lies outside the unit circle. VAR satisfies the stability condition.
View / Lag Structure / AR Root Graph
The VAR model satisfies the stability condition, as indicated by the inverse roots of the AR characteristic polynomial all lying inside the unit circle in the complex plane. This implies that the model is stable and that the time series will exhibit stationary behavior in the long run. Consequently, forecasts made using this model are expected to be meaningful and convergent, without leading to non-stationary or explosive behavior.

Procs/Make Model
We make three equations from VAR model. We use the first equations for predecting 2024 monthly inflation rates.

We choose “Solve” and simulation type is “Deterministic” and put the forecasting period (2024m01 2024 m11) to the “Solution Sample” section.
Now. It is done.
We choose Procs/Make Graph and please fill the other options as following.

The VAR model's forecasts for the CPI have exceeded the actual series values for the period of June 2024 to November 2024.

We try to forecast with stochastic simulation type.

The result is here.

The graph displays the Consumer Price Index (CPI) forecasts for January and November 2024. The following comparison highlights how each forecasting method has overestimated the actual data.

Forecast time. We need to resize the range because we forecast 2024m12 and 2025m01.
Proc / Workfile Structure

Procs-Forecast in the VAR screen:
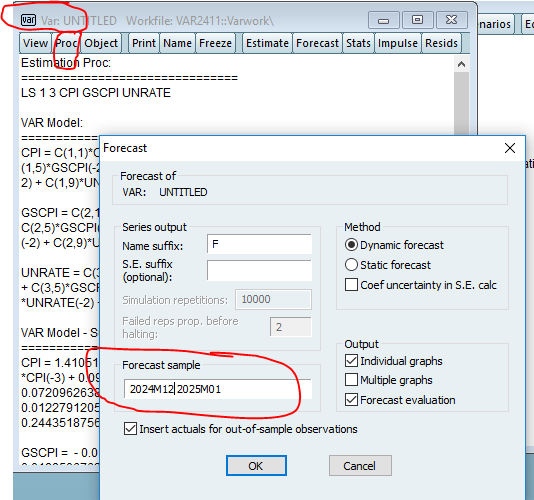
Yes these are the forecast numbers.

Conclusion
Forecasting inflation is a complex task that requires a careful consideration of various economic factors. This post has walked you through a detailed process using a Vector Autoregression (VAR) model within EViews to approach inflation forecasting in a structured and data-driven way. We've taken into account significant predictors like the Global Supply Chain Pressure Index and unemployment rates to understand their impact on the Consumer Price Index.
Our analysis has confirmed that all series are integrated of order 1, I(1), ensuring that the VAR model is built on a sound statistical foundation. The selection of a lag order based on the lowest AIC value and the subsequent diagnostics have shown that our model does not suffer from residual serial correlation and satisfies the stability condition — crucial checks for the reliability of our forecasts.
In our exercise, both deterministic and stochastic forecasting methods were explored, and interestingly, both methods resulted in forecasts for early 2024 that overestimated the actual CPI values. This outcome emphasizes the unpredictability inherent in economic forecasting and the importance of continuous model evaluation.
As we look ahead and extend our forecasts to December 2024 and January 2025, we remain cognizant of the limitations and strengths of the VAR model. This post has demonstrated that while no model can predict the future with complete accuracy, a well-specified VAR model can serve as a powerful tool in the economist's toolkit for understanding the dynamic interplay between various economic indicators and inflation.
Engin YILMAZ ( Veridelisi )
Python VAR Analysis My Github Repo
