


Elon Talks Tesla Falls (The More Elon Talks, the More Tesla's Stock Drops)
Elon Talks Tesla Falls (The More Elon Talks, the More Tesla's Stock Drops)

How Elon’s Tweets Affect Tesla Stock Price
Imagine Elon Musk is tweeting a lot on X, and people are retweeting and commenting on those tweets. We want to find out if these tweets, retweets, and comments change Tesla’s stock price. We have data from January 20, 2025, to February 28, 2025, with details about how many tweets Elon posted each day, how many retweets and comments they got, and what Tesla’s stock price was.

Here’s what we did:
Collected Daily Totals: We counted how many tweets Elon posted each day, added up all the retweets, and added up all the comments for those days.
Tesla Stock Prices: We used the actual Tesla stock closing prices you gave us for 27 days (Jan 21 - Feb 27).
Checked the Connection: We used a math tool called "regression" to see if more tweets, retweets, or comments make Tesla’s stock price go up or down.
What We Found (Preliminary)
Tweets: Days with more tweets seem to slightly lower the stock price.
Retweets: Lots of retweets have a tiny effect, usually lowering the price a bit.
Comments: More comments also seem to push the price down slightly.
Big Picture: From January to February, Tesla’s stock price dropped from around $424 to $282, and tweet activity might be part of why, but other things (like market news) could matter too.
What We’re Looking At
This dataset provides a daily analysis of Elon Musk's Twitter activity and Tesla's stock price movements between January 21 - February 27, 2025. It includes:
Elon Musk's Twitter Metrics
Number of tweets posted each day
Total retweets received
Total comments received
Tesla's Stock Performance
Daily adjusted closing price
This data helps analyze the correlation between Elon Musk's social media activity and Tesla's stock price fluctuations during the given period. The dataset can be used for trend analysis, sentiment impact studies, and financial forecasting.
Tesla’s Stock Moves: How much the stock jumped or dropped each day (in percent).(Yfinance)
Musk’s X Posts: How many times Elon hit “post” on X—tweets, retweets, or whatever chaos he stirs up.(Data)
Graph Analysis
Daily Tweets by Elon Musk:
This graph shows the number of tweets Elon Musk posted each day.
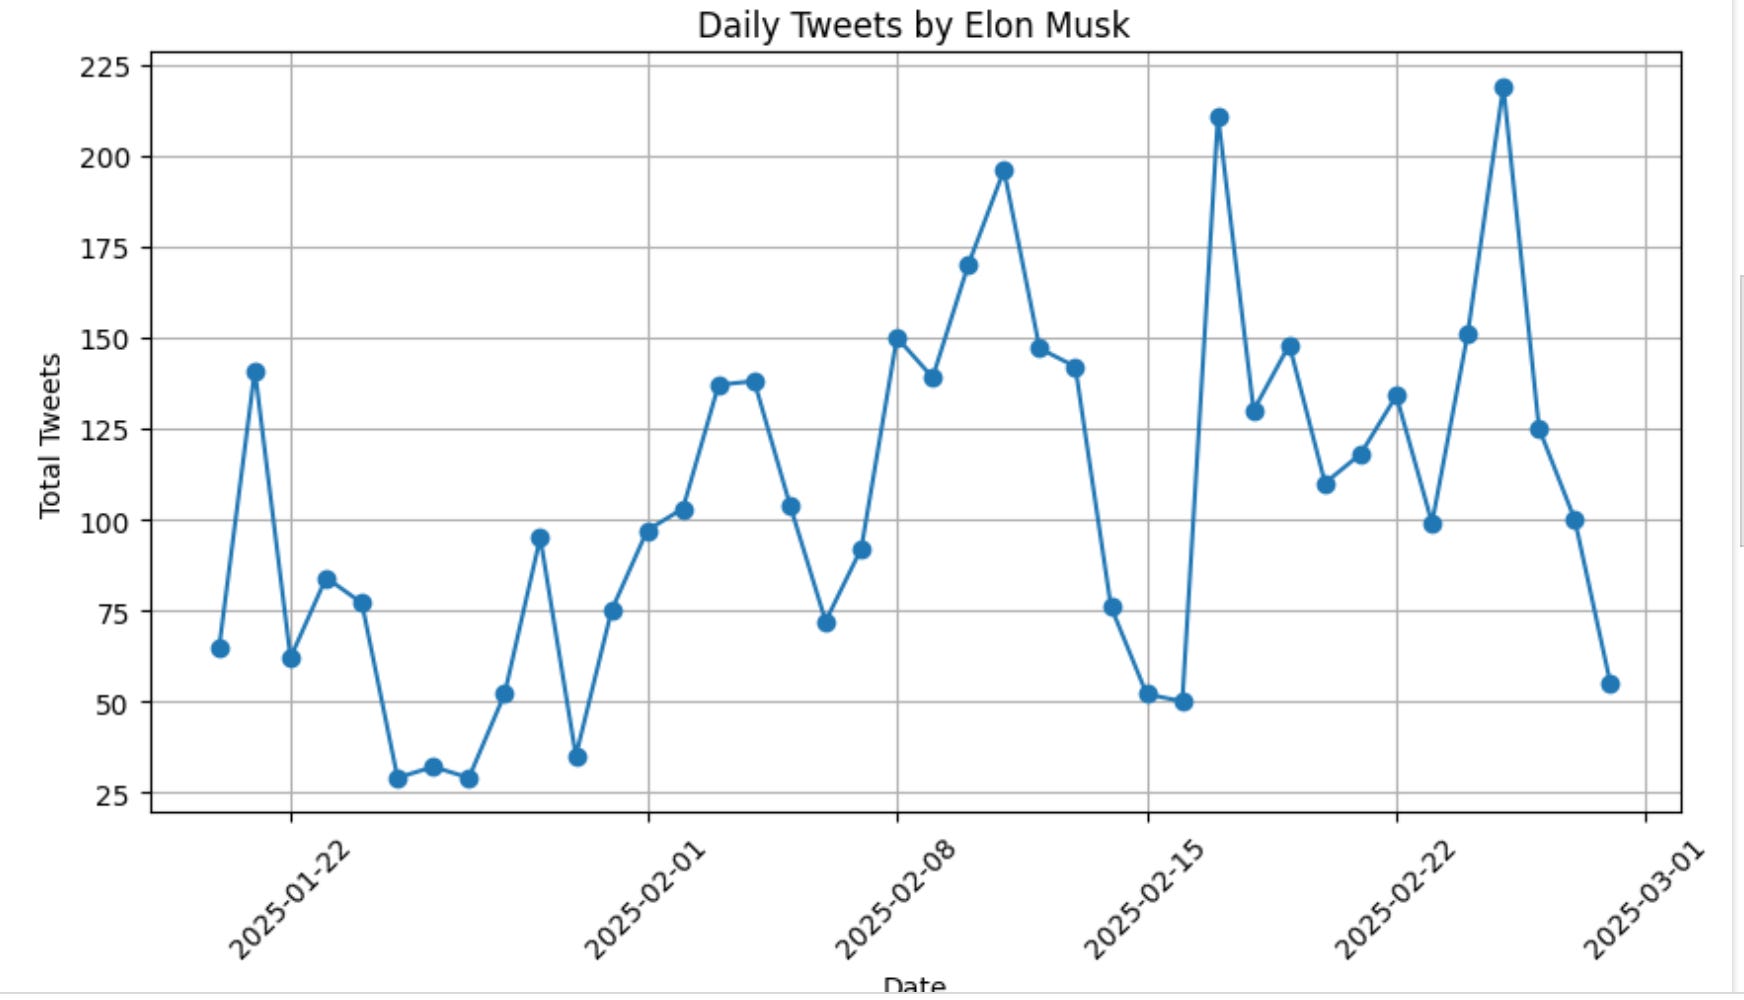
The activity fluctuates, with some days having a higher number of tweets than others. Peaks in tweet activity could indicate significant events or discussions.
Max Tweets in a Day: 219
Min Tweets in a Day: 29
Average Tweets per Day: 106.02
Daily Retweets on Elon Musk's Tweets:
This graph illustrates how many times his tweets were retweeted each day.

Some days experience major spikes in retweets, indicating highly engaging or viral content. A correlation might exist between higher tweet counts and increased retweets, but engagement levels can vary.
Max Retweets in a Day: 2,197,849
Min Retweets in a Day: 79,155
Average Retweets per Day: 1,146,262.65
Daily Comments on Elon Musk's Tweets:
This graph represents the total number of comments received on his tweets per day.

A high number of comments on specific days may indicate controversial or widely discussed topics. Spikes in comments could align with major announcements or interactions with other notable figures.
Max Comments in a Day: 762,208
Min Comments in a Day: 45,074
Average Comments per Day: 420,196.8
Tesla Stock Price Graph
The last graph illustrates Tesla's daily stock price movements between January 20 - February 28, 2025. The trend shows fluctuations, with a noticeable decrease in stock price during certain periods.

This visualization helps track market trends, investor reactions, and possible correlations with external factors such as company news, economic conditions, or Elon Musk's social media activity
Analysis
1. Total Tweets vs Tesla Stock Price (Left Plot, Green Dots)
This graph shows how the number of tweets Elon Musk posted each day (on the horizontal X-axis, ranging from 0 to 225) relates to Tesla’s stock price in USD (on the vertical Y-axis, ranging from $280 to $420). Each green dot represents a day between January 20 and February 28, 2025. You can see that when Elon tweets more (e.g., 50–200 tweets), the stock price tends to be lower, often around $280–$340, especially in February, while fewer tweets (e.g., 0–25) are linked to higher prices, like $400–$420 in January. This suggests a possible negative relationship—more tweets might mean a lower stock price—but the dots are scattered, so other factors (like news or market trends) could also be influencing the price.

2. Retweet Count (Millions) vs Tesla Stock Price (Middle Plot, Orange Dots)
This graph examines the relationship between the total number of retweets for Elon’s tweets each day (on the X-axis, scaled to millions, ranging from 0 to 2.0) and Tesla’s stock price in USD (on the Y-axis, ranging from $280 to $420). Each orange dot represents a day in the same period. Higher retweet counts (e.g., 1.0–2.0 million retweets) often correspond to lower stock prices, around $280–$340, while lower retweet counts (e.g., 0–0.5 million) are linked to higher prices, like $400–$420. The relationship isn’t very clear or strong because the dots are spread out, indicating that retweets might have a small or inconsistent effect on the stock price, possibly overshadowed by other factors.
3. Comment Count (Thousands) vs Tesla Stock Price (Right Plot, Red Dots)
This graph shows the connection between the total number of comments on Elon’s tweets each day (on the X-axis, scaled to thousands, ranging from 0 to 700) and Tesla’s stock price in USD (on the Y-axis, ranging from $280 to $420). Each red dot represents a day from January 20 to February 28, 2025. Days with more comments (e.g., 400–700 thousand) tend to have lower stock prices, around $280–$340, especially in February, while days with fewer comments (e.g., 0–200 thousand) are associated with higher prices, like $400–$420 in January. The scattered dots suggest a negative trend—more comments might lower the stock price—but other influences could also be at play, making the relationship not perfectly straightforward.
Impact of Twitter Variables on Tesla Stock Price

Total Tweets (-0.1427 correlation)
The negative correlation suggests that when Elon Musk tweets more, Tesla’s stock price tends to decrease slightly. This could indicate that frequent tweeting creates uncertainty or sparks controversy, leading to temporary stock declines. However, the effect is weak, meaning other factors likely have a stronger influence on price movements.Retweet Count (-0.0627 correlation)
A very low negative correlation implies that the number of retweets does not significantly impact Tesla’s stock price. This suggests that virality alone does not move the market, and investors may focus more on tweet content rather than engagement levels.Comment Count (-0.0939 correlation)
Similarly, the number of comments has a weak negative impact on Tesla’s stock price. Higher comments could indicate controversial or polarizing tweets, potentially leading to market uncertainty. However, the effect is minimal, reinforcing the idea that broader market factors drive Tesla’s price more than Twitter engagement alone.
Code: https://github.com/veridelisi/PythonShortCodes/tree/main/Musk
Engin YILMAZ (@veridelisi)
------------------
TO: Elon Musk erm71@who.eop.gov
------------------
Hello Elon,
I just wanted to personally thank you for your invaluable contribution to the absolute annihilation of the United States. What you are doing is unforgivable.
With deep contempt,
U.S. Citizen
------------------