


April 2025: How FX Hedging Amplified the US Dollar's Weakness
April 2025: How FX Hedging Amplified the US Dollar's Weakness

This post summarizes "April 2025: How FX Hedging Amplified the US Dollar's Weakness" written by Hyun Song Shin, Philip Wooldridge and Dora Xia.

Introduction
When the U.S. announced new tariffs in early April 2025, a peculiar "triple decline" hit American markets: stocks, bonds, and the U.S. dollar all fell together. Initially, this led to speculation that global investors were losing faith in the dollar and U.S. assets, signaling a reduced role for the dollar worldwide. However, evidence now suggests a different explanation: non-U.S. investors actively engaged in hedging to protect their unhedged dollar investments from further losses.
When the US dollar depreciated in early April 2025, investors faced losses on the unhedged portion of their dollar portfolio. To mitigate these losses, some opted to increase their hedge ratio, ex post. This amplified depreciation pressures on the dollar.(Shin,2025)
Dollar Positions
Dollar assets are a large share of non-US investors’ portfolios
This graph shows the share of foreign portfolio assets held in US securities, by instrument.

As of March 2025, non-US investors held $17.6 trillion in US equities and $13.6 trillion in US bonds (both long-term and short-term combined), indicating that equities now represent a larger dollar amount of their US holdings.
This graph shows the share of US securities held by foreign investors.

Although non-US investors hold a large and growing amount of US equities in absolute terms (as shown in Panel A), their share of the total US equity market remains relatively small. As of early 2025, foreign investors hold only 18% of the outstanding US equities, compared with 33% of US Treasury securities and 21% of US agency and corporate bonds.
While equities have become increasingly important in non-US investors’ own portfolios, foreign investors still represent a much smaller portion of the US equity market compared to their larger footprint in the US fixed income markets.
Non-US investors likely hold an even larger share of the $13 trillion in dollar bonds issued by non-US borrowers, mostly in the offshore (eurodollar) bond market.(Shin,2025)
This graph shows the foreign holders of US securities, March 2025.

GB: United Kingdom, KY:Cayman Islands, CA:Canada, JP:Japan, LU:Luxembourg, ASEAN:Association of Southeast Asian Nations (e.g. Indonesia, Malaysia, Singapore, Thailand, Philippines, etc.), CN:China, TW:Taiwan, KR:South Korea, HK:Hong Kong
Asian holdings are larger than indicated by adjusted data. They also include holdings through European custodians and funds in Caribbean and European financial centers.
The FX Positions
The growth of foreign portfolio investments has gone hand in hand with the growth of foreign exchange (FX) derivatives, which are used to hedge the associated currency risk. This hedging is typically achieved using foreign exchange (FX) swaps and forwards. The notional value of FX derivatives at the end of 2024 was $130 trillion, according to BIS statistics on over-the-counter derivatives. This is more than three times the outstanding cross-border bond holdings.
The FX Positions’ Cost
The key driver of these costs is the spread between the short-term dollar interest rate and the foreign rate, as FX swaps and forwards are typically short-term contracts. Investors often rely on short-term instruments to hedge their investments in long-term securities, and thus hedging becomes more expensive when short-term dollar interest rates rise. (Shin,2025)
Hedging tends to become less attractive when the US yield curve flattens or inverts, a situation that frequently coincides with such market conditions. Studies(Nenova, 2025) show that non-US investors’ hedging activity is positively related to the steepness of the US dollar yield curve.

Lower FX Hedge Ratios
Among Asian investors, there is evidence that some have lowered their hedge ratios on foreign currency portfolios in recent years. For example, the hedge ratio of major Japanese life insurers fell from around 60% in 2021 to 40% by 2024 (Bank of Japan, 2025). Similarly, Taiwanese life insurers had hedged approximately 65% of their holdings by late 2024 — a level close to historic lows, based on estimates from insurers’ financial reports (Bank of America Global Research, 2025). Some European pension funds have also reportedly reduced their hedge ratios in recent years (Atkins, 2025).
Two Key Drivers Behind Lower FX Hedge Ratios
1- First, rising hedging costs have made unhedged positions more attractive. Since 2022, when the US Federal Reserve began its latest rate-hiking cycle, short-term US dollar interest rates have climbed, driving up FX hedging costs (Graph 2.A).

These costs have been especially high for Asian and European currencies, where domestic short-term rates remained lower and local yield curves steepened (Graph 2.B).

Graph B shows the interest rate differentials between the US dollar and other currencies — a key driver of theoretical FX hedging costs. When US rates rise relative to local rates, hedging becomes more expensive in principle.
However, Graph A shows the actual hedging costs observed in the FX forward markets. These realized costs reflect not only interest rate differentials but also other factors like cross-currency basis, market liquidity, and supply-demand imbalances.
For Latin America, despite having the highest rate differentials (Graph B), actual hedging costs remain low or even negative (Graph A), likely due to favorable basis conditions and strong USD supply in local markets.

In contrast, Asia and Europe show both high differentials and high realized hedging costs.
2- Second, a stronger US dollar has reduced the incentive to hedge. As the dollar appreciated between 2021 and 2024, many non-US investors preferred to leave their dollar exposures unhedged in hopes of benefiting from further currency gains.
Higher FX Hedge Ratios
When the US dollar depreciated in early April 2025, investors faced losses on the unhedged portion of their dollar portfolio. To mitigate these losses, some opted to increase their hedge ratio, ex post. This amplified depreciation pressures on the dollar. (Shin,2025)
When an investor buys dollar bonds and immediately hedges, the exchange rate impact is minimal because spot purchases of USD are offset by forward sales.
However, if the investor initially buys dollar bonds without hedging (or lower hedging), and later decides to hedge ("ex post hedging"), USD will weaken.
Hedging from the beginning (Fully Hedged Purchase):
When a euro area investor buys a USD bond and fully hedges immediately:
1️⃣ Bond purchase (USD bond → buys USD in spot market).
2️⃣ At the same time, the investor sells USD forward (enters forward contract to sell USD and receive EUR in the future).
✅ Result:
No USD deposit (no cash USD position).
The spot USD purchase is immediately offset by the forward USD sale.
Therefore, minimal impact on spot exchange rate:
The market sees both buying USD spot and selling USD forward at the same time.
No strong one-sided pressure on spot FX market.
Ex-post hedging (after buying bond Unhedged):
When the investor initially buys USD bonds unhedged and later decides to hedge:
1️⃣ The investor enters into an FX swap:
Spot leg: Sells EUR and buys USD (creates USD cash position).(Graph3-B)
Forward leg: Agreement to sell USD for EUR at a future date (off-balance sheet liability).(Graph3-B)
2️⃣ To complete the hedge, the investor sells the newly acquired USD cash position in the spot market, buying back EUR.(Graph3-C)
✅ Result:
Spot USD selling pressure.
USD weakens against EUR.

We can observe this movement from different indicators
A. Change in cross-currency basis between March and April/May 2025
Between March and April/May 2025, the cost of hedging USD investments increased for many currencies. The more negative cross-currency basis shows that many investors wanted to hedge their USD exposures, increasing demand for USD in the FX swap market. As a result, it became more expensive to obtain USD funding via FX swaps.

B. Change in US dollar index (DXY) by regional trading hours
Because of strong hedging demand, it became more costly to hedge dollar exposures in the FX swap market. At the same time, intraday patterns in both the dollar exchange rate and bond prices suggest that Asian investors' hedging activity contributed to the dollar's decline in April/May. As shown in Graph 4.B, most of the dollar's depreciation during this period happened while Asian markets were open.

C. Change in US Treasury prices by regional trading hours
During the same Asian trading hours when the dollar was weakening, US Treasury prices were actually rising (as shown in Graph 4.C). This indicates that the dollar’s depreciation was not driven by selling of US assets — at least not at high frequency and not in US government bonds.

D- Other factors
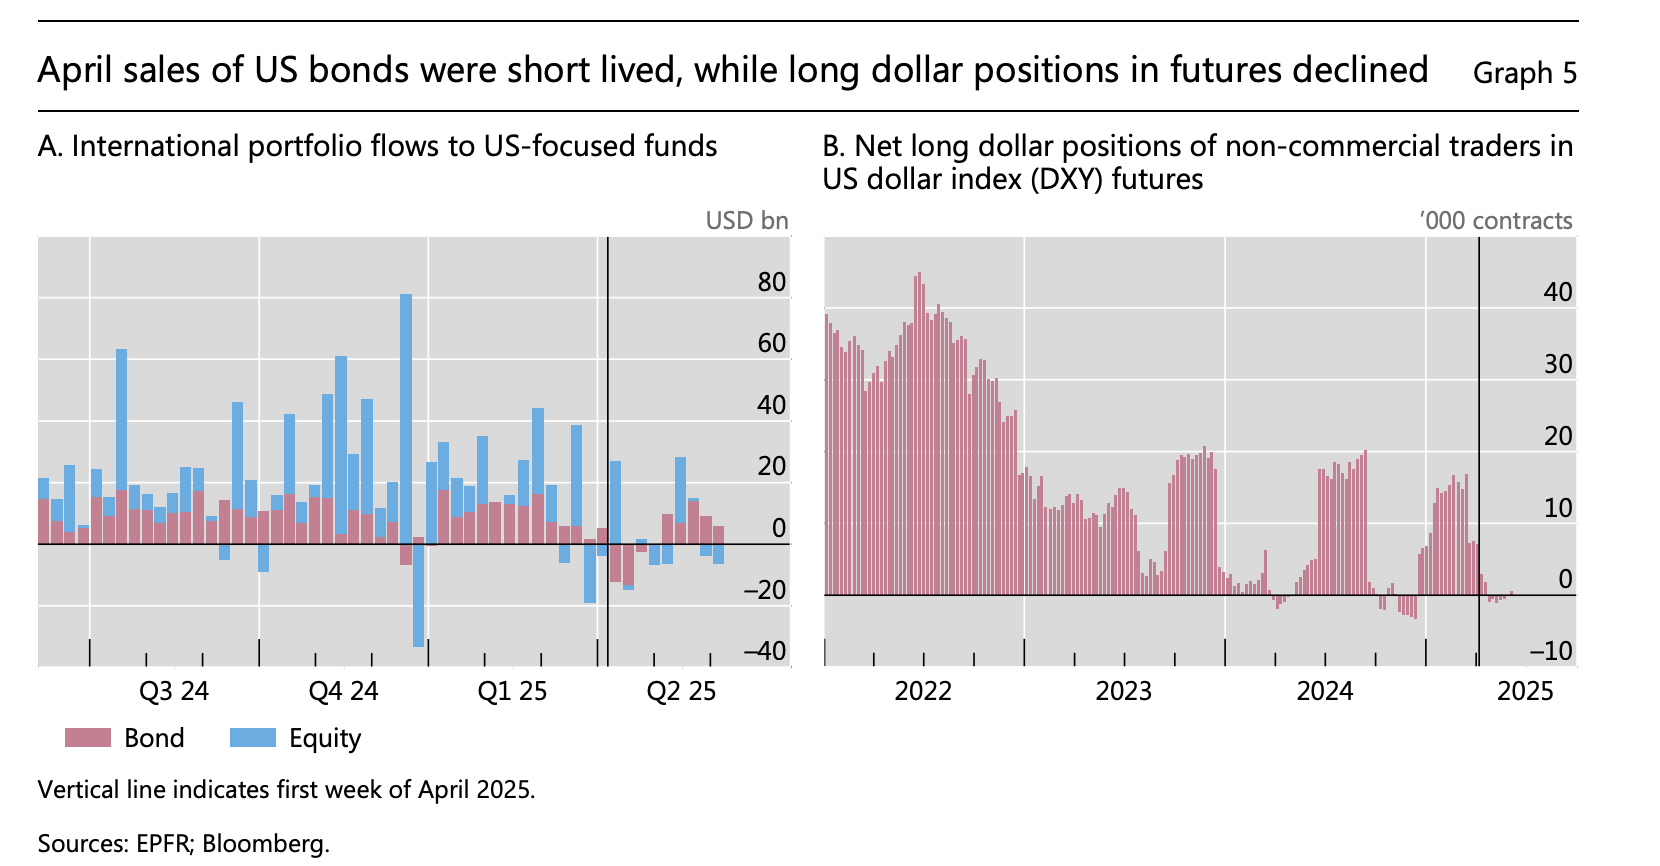
Other factors were less important than hedging. Investment fund data for April and May show that foreign investors continued to put money into US assets, though at a slower pace (Graph 5.A). In speculative markets, futures data show a clear drop in long dollar positions in April. However, both the speed and size of this decline were similar to past episodes of dollar weakness and were not unusual (Graph 5.B).
References
Atkins, A (2025): “European pension funds risk driving sharp dollar sales, BNP says”, Bloomberg News, 12 June.
Bank of America Global Research (2025): “USDTWD: after the fall”, Asia FI & FX Strategy Viewpoint.
Bank of Japan (2025): Financial System Report, April.
Nenova, T, A Schrimpf and H S Shin (2025): “Global portfolio investments and FX derivatives”, BIS Working Paper, no 1273, June.
Hyun Song Shin, Philip Wooldridge and Dora Xia (2025): US dollar’s slide in April 2025: the role of FX hedging, BIS Working Paper, June 2025


